Workload graph & capacities
Workload Graph
When you configure your boards, you can see a "Workload graph" for your team as shown below.
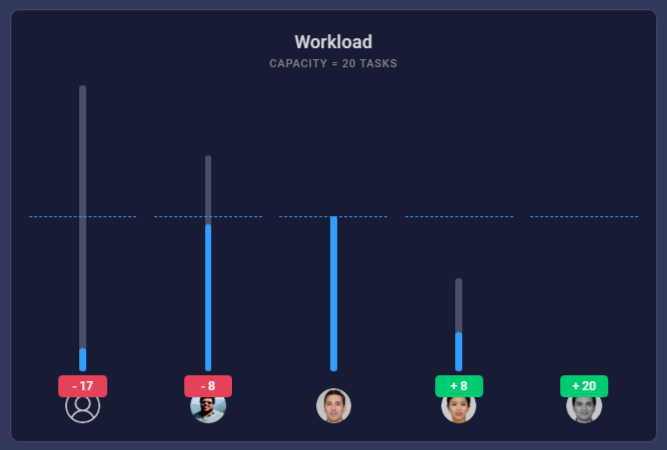
Here you can see an overview of your team members and their workloads. This graph shows the number of tasks or the time estimates depending on the view mode.
Workload graph is helpful to identify people who have less tasks and who are overloaded. This allows you to easily delegate tasks between different team members and improve the productivity of your team.
You can see more details of each user by mouse hovering on the graph. If you define a custom workload capacity, it will be shown as a dashed line in the graph. People who have tasks more than this line is overloaded.
Workload Capacity
You can define a custom workload capacity for your team via widget settings. Capacity can be added as number of tasks or time estimates in hours. Following video demonstrates how to define a custom workload capacity for your team.